
Kinematics | O Level Physics 5054 & IGCSE Physics 0625 | Detailed Free Notes To Score An A Star (A*)
1.0 Lesson Objectives
- Speed, Velocity and Acceleration
- Graphical Analysis of Motion
- Forces
- Newton’s Laws
- Balanced and Unbalanced Forces
- Friction
- Circular Motion
1.1 Speed Velocity and Acceleration
Speed:
- Speed is the distance covered per unit time.
- We take the SI Unit of Seconds as a ‘unit’.
Calculating Speed:
![]()
![]()
Velocity:
- Velocity is distance covered per unit time in a specific direction
- In other words, velocity is speed in a specific direction.
- Speed is a scalar quantity, only having magnitude whereas Velocity is a vector quantity with both a magnitude and a direction.
Calculating Velocity:
![]()
Or
![]()
Average Speed:
- In cases where our body is moving at various speeds in different intervals of time, we sometimes have to calculate the average speed, for example, in case of a car journey between two cities.
- In order to calculate average speed, we divide the total distance covered by the total time taken.
![]()
Acceleration:
- Acceleration is the rate of change of velocity.
- In other words, acceleration means velocity change per unit time
- When our acceleration is zero, our body has a constant velocity.
Calculating Acceleration
acceleration = velocity change/time OR Acceleration = Change in Velocity/Time ![]() This can also be written in its more commonly used form: v = u + at
This can also be written in its more commonly used form: v = u + at
Uniform and Non-Uniform Acceleration:
- Uniform acceleration means that the velocity of our body is changing at the same rate over any interval of time.
- For example, if every second, the velocity of our moving body goes up by 2 m/s, it has a uniform acceleration of 2 m/s2.
- However, in case our moving body speeds up and then slows down, it has a non-uniform acceleration.
1.2 Graphical Analysis of Motion:
Now that we know the basic definitions of speed, velocity and acceleration, we can understand their graphs as the connection between their graphical representations. We will create our own examples to understand the representation of each of these three terms.
Example 1: Constant Speed:
Distance-time Graph:
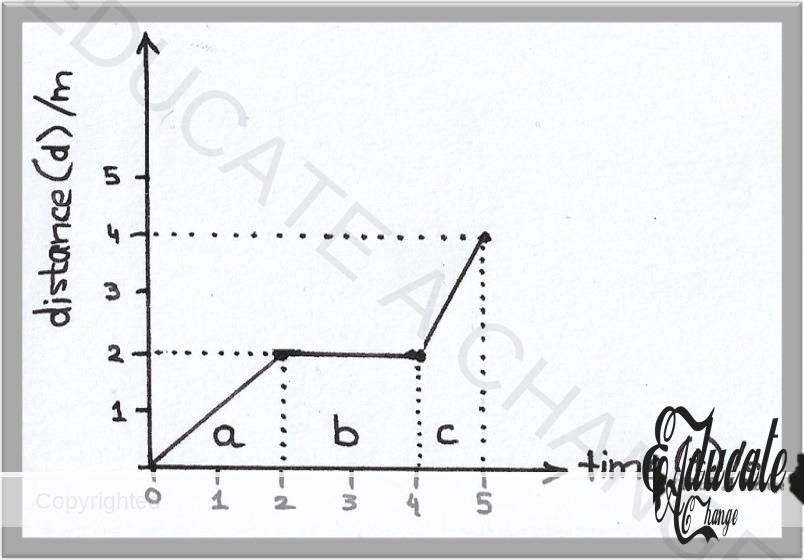
Consider this example.
- A trolley starts moving from rest at 0 seconds and in the next two seconds, it travels a distance of 2 meters. (section A of the graph).
- In the next 2 seconds till 4, the trolley still has only traveled 2 meters. (the section B of the graph). What this tells us is that the trolley has not moved in those two seconds and hence at this stage, its speed is zero.
- In the section C of the graph, the trolley has moved a total distance of 4, which means that in the time from 4 seconds to 5 seconds, the trolley has moved 2 more meters.
- If we want to calculate the distance moved in a particular section of the graph, we subtract the initial distance in that portion from the final distance. For example, in the Section C, the trolley moved 2 meters since its final distance in the section is 4 meters and initial distance in that section was 2 meters. So, 4 -2 = 2 meters covered in Section C of the graph.
- Similarly, the final distance and initial distance are both 2 in the section B of the graph, which tells us that the trolley moved 2-2=0 meters in the section, i.e. It was at rest from the time 2 seconds to 4 seconds.
Speed-Time Graph:
Now we will convert the same journey into a Speed-time graph. For this purpose we need to calculate the speed of the trolley in each part of the journey.
- As we know, speed is the distance over time so for section:
- A: distance is 2m and time taken is also 2s, hence the speed was 2/2 = 1m/s
- B: distance covered was zero and time taken was 2s, so speed was 0/2 = 0 m/s
- C: distance covered was 2m and time taken to cover that distance was 1s, so the speed was 2/1 = 2m/s
The following speed time graph is then created for this journey using the speeds calculated.
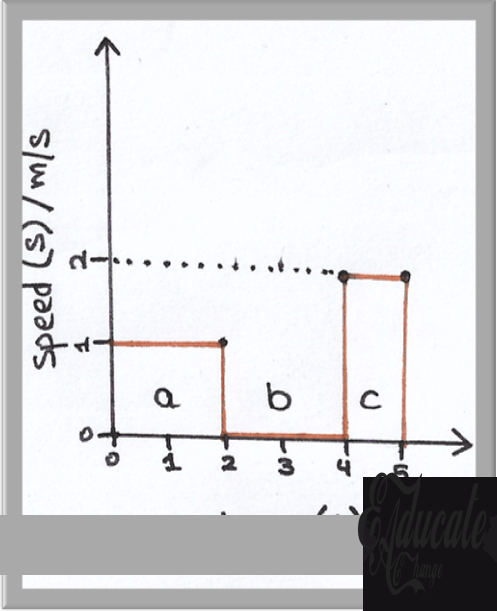
The graph tells us the speed at various intervals of time. We can use a speed-time graph to calculate the distance as well. In order to calculate distance from a speed-time graph, we simply calculate the area under the graph. Hence, for section:
- A: The width of rectangle is 2 and height is 1 so the distance covered is 2×1 = 2m.
- B: No graph exists or simply said, there is 0 area under the curve hence distance covered was 0m.
- C: The width of the rectangle is 1 and the height is 2 so the distance covered is 1×2 = 2m.
This can be cross checked from the initial graph which shows that the calculations are correct.
Example 2: Non-Constant Speed:
The previous example showed a graph that has constant speed in each interval of the graph. Now we will take another example of a trolley where the trolley moves at a constant acceleration and non-constant speed. Consider this speed-time graph:
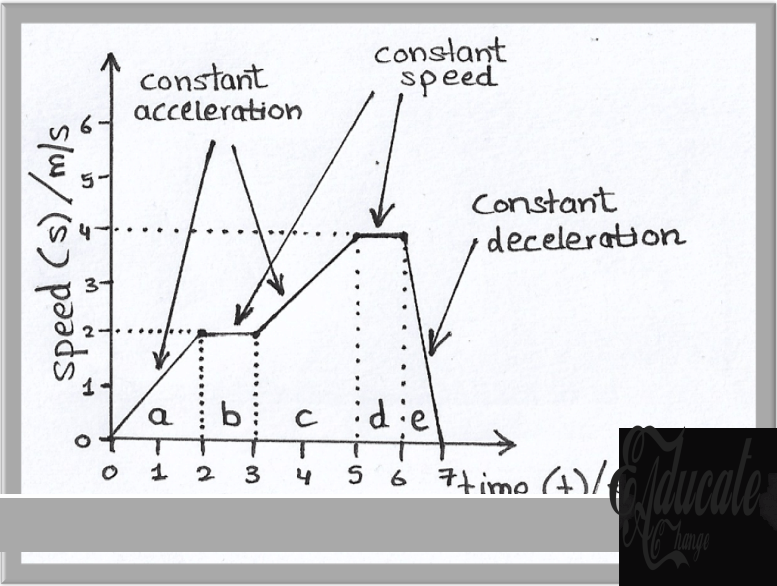
Speed-Time Graph:
In this graph, in section:
- A: the trolley starts at speed 0m/s and reaches a speed of 2m/s in the first 2 seconds. The distance covered is ½ x 2 x 2 = 2m. Also, if we want to calculate the acceleration, we divide change in speed by time i.e. 2/2 = 1m/s2 acceleration. Since the speed is uniform, the acceleration is constant for the interval.
- B: the speed becomes constant at 2 m/s and the distance traveled is 1s x 2m/s = 2m.
- C: once again, we have a constant acceleration here. Since, the speed changes from 2m/s to 4m/s in a time interval of 2 seconds, our acceleration is 2/2 = 1m/s2 in this interval as well. The distance covered here is ½ x 2 x (2+4) = 6ms (trapezium)
- D: we again have a constant speed interval where there is no acceleration and the distance covered here will be 1 x 4m/s = 4m.
- E: We have a constant deceleration where our speed decreases from 4m/s to 0m/s in a matter of 1 second. This means the distance covered here will be ½ x 4 x 1 = 2ms and the deacceleration is 0-4/1s = – 4m/s².
Now we can create a distance-time graph and an acceleration-time graph for the same example.
Distance-time Graph:
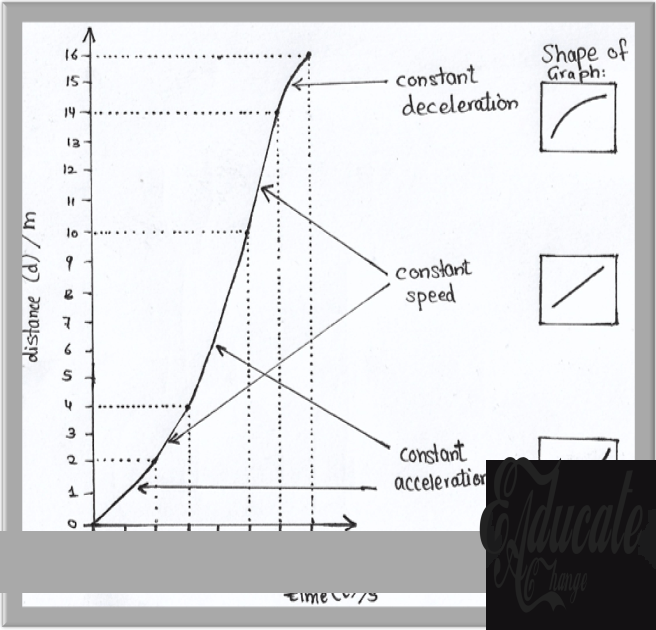
In this graph, we can see that there are three different shapes of the curve that indicate three different events. These are the constant speed, the acceleration and the deceleration shapes in a distance-time graph. A fourth possibility is a straight horizontal line which depicts no speed as in the previous example. By the same calculations as the previous example, we can recheck that the speed is the same as the speed-time graph for each section. However, the calculations for the curves are beyond the scope of this subject.
Acceleration-time graph

One new thing to note in this graph is the use of negative axis. This means that if the velocity was increasing for our trolley in the first 6 seconds, now in the last second the change in velocity is opposite direction, meaning that there is a deceleration or reduction in velocity over the period of time. By finding the area under the curve, we can calculate speed and verify that is it the same as in the speed-time graph. For example, in the last 1 second (6 to 7), there is a deceleration of 4 m/s² in one second which means that over the course of this one second, there is a drop in speed by 4 m/s which we can verify to be the case in our speed-time graph.
Graphical Analysis of Motion
Acceleration of Free Fall
- When a body falls near earth, without air resistance, it accelerates downward as the Earth’s gravitational pull places a net force on the body. This acceleration is called the acceleration of free fall and is about 9.8 m/s2 which is usually taken as 10m/s² in calculations.
- In the absence of air resistance, this acceleration is constant at 9.8 m/s² since there is no force to oppose the Earth’s gravitational pull.
- If two bodies are free falling without air resistance from the same height, they will reach earth at the same time as there is no force to stop or decrease their motion. They will accelerate at the same pace and land at the same time.
- If air resistance is taken into consideration, the acceleration will then be opposed by the air resistance and slowly turn to zero when the air resistance becomes equal to the free fall acceleration. This is when there are no resultant forces acting on our falling body and the body starts to fall at a constant speed.
- This constant speed is called terminal velocity.
- In case there are two objects falling with air resistance from the same starting height, the heavier object will reach the ground faster than the lighter object since the weight of the heavier object will result in a higher terminal velocity where the air resistance will take more time to cancel out the downward forces as compared to the lighter object.
- This is also the case when something is thrown upward, for example throwing a ball in the air.
1. 3 Force:
- Force can be defined as a push or pull that one body exerts on another body. For example, if a person is sitting on a chair, the person exerts a force on the chair and the chair exerts a force on the ground on so on.
- A force can have three major effects on a body:
- It can change the speed/velocity of the body,
- It can change the direction of the body,
- It can change the shape of any body.
1.4 Newton’s Laws of Motion:
Newton’s First Law:
- The law states that anybody will remains in its state, of rest or of uniform motion, until an external force is applied to change its state.
- For example, a trolley is moving at constant speed. In that case, there is no net force being applied on the trolley. Now, in order to change this constant movement state of the trolley, a force must be applied to it otherwise it will continue to move at that constant speed forever.
Newton’s Second Law:
- The second law states that net force (the vector sum of all forces being applied) is the product of a body’s mass and acceleration.
- This can be used to explain the first law as well. When a body has no acceleration, there is no change in its speed so if the body is still it remains still at speed zero or if a body if moving, it keeps moving at constant speed since according to this law, the zero acceleration into the mass of the object means that there is zero net force on the body. Hence, in order to change this state, a net force must be present. (proving relation between the two laws).
- If a body is moving, it must then follow the law and hence this formula:
Force: mass x acceleration f=ma
Newton’s Third Law:
- The third law of motion states that for every action, there is a reaction; equal in magnitude but opposite in direction.
- This is called the law of action and reaction.
1.5 Balanced and unbalanced forces:
- When an object has no resultant force i.e. The object is not accelerating, the forces acting on the object are balanced. We can also say that an object is in equilibrium when the forces are balanced. This means if we vector combine all the forces acting on a body, we will get a resultant force of zero.
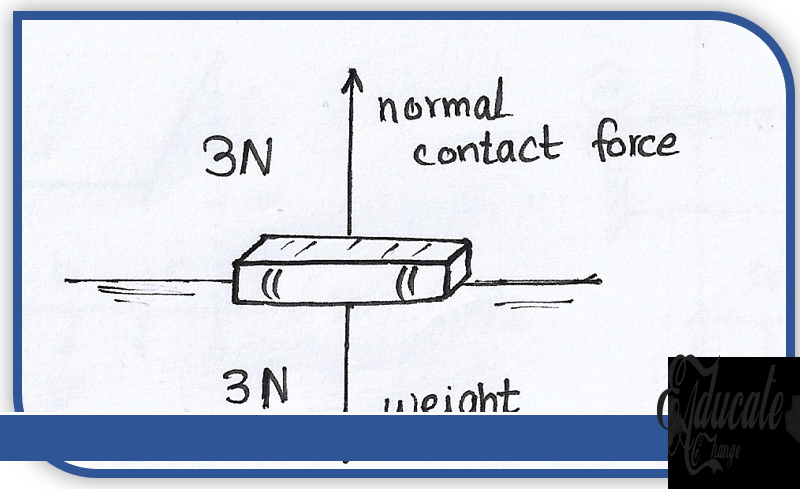
- For example, here is a book resting on a table.
- The weight of the book acts downward on the table.
- However, the table exerts an equal force back at the book which is called the normal force (acts perpendicular to the surface of contact) and hence cancels out the weight of the book.
- This causes the book to stay in static equilibrium i.e. remain stationary at its position.
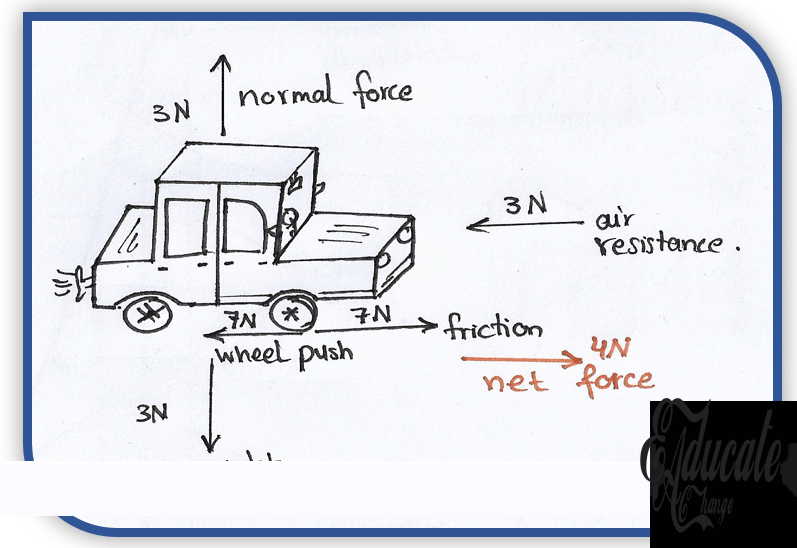
- In the above diagram, the car is moving in the forward direction.
- Here the wheels of the car apply a force in the backward direction and the friction (the reaction force) pushes the car forward.
- The air resistance is also acting on the car trying to slow it down, and the weight and normal contact forces are cancelled out.
- The friction has a higher magnitude than the air resistance, making the forces unbalanced and hence, the car is accelerating in the forward direction.
- This is an example of unbalanced forces, which tells us that when forces are unbalanced, there is always a net force acting on the object.
1.6 Friction:
Friction is a contact force that slows down moving objects. (i.e. it opposes the direction of object motion). Friction is only present when there is some sort of contact between things. In the previous car example, we can see that friction acts between the wheels and the surface of the road, where when the wheels try to push the surface in the backward direction, friction pushes them in the forward direction and hence, allows the car to move forward.
Advantages and Disadvantages of Friction:
Friction can be both useful and disadvantageous for us, depending on the scenario. Advantages:
- In case of walking, friction helps us to move.
- Friction is also the reason we are able to apply breaks on cars and bikes.
Disadvantages:
- On rough surfaces, friction leads to motion being difficult and take more energy or engine power to speed up things than on a less friction surface.
- Friction causes moving parts in machinery to tear down.
How to overcome friction?
In case friction is proving disadvantageous for us, we can reduce the effects of friction:
- By using lubrication such as oil in machinery.
- By making our surfaces smooth.
- By using ball bearings in machinery which reduce surface contact and so ultimately, reduce friction.
1.7 Circular Motion:
So far, we have discussed the motion of objects in straight paths. However, motion of objects can also be in circular paths.